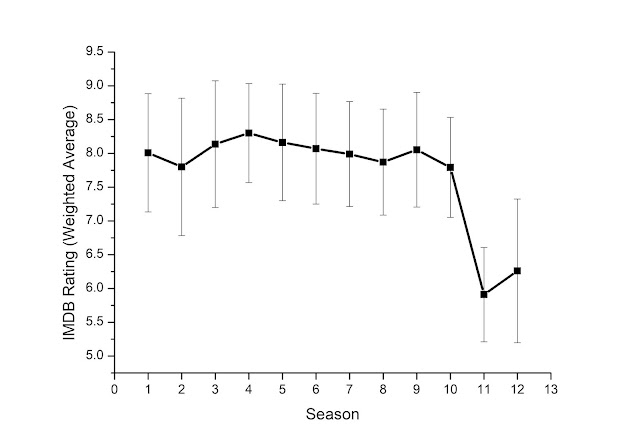
Appreciation Index
One of the figures easily available is the Appreciation Index. It is a very bad figure, as explained in the wikipedia article. However, trends are visible. Here is the raw data, by episode number of the reboot run (1 = Rose, 165 = The Timeless Children):
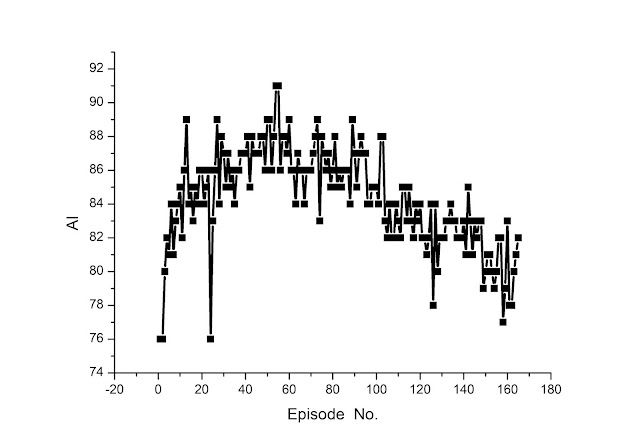
Figure 1: Appreciation Index against Episode
This data is very noisy, and we can clean it up by looking at the moving five figure average, thus:
Figure 2: The moving five figure average of the data from Fig. 1
This effectively despikes the data, but amplifies the event of singular bad episodes (such as Sleep No More causing a local minima in Capaldi's run).
What we can see is that the first few episodes of the reboot had relatively low AI values, which climbed rapidly to be quite good as the audience share dropped a bit. This represents people who don't like Dr. Who, but watched because they were curious.
The general trend from the start is a constant increase in AI until the end of David Tennant's tenure. Matt Smith brought about a precipitous drop which stabilised at around an AI of 86 during his run. Capaldi taking over caused another drop to around 83. Episode 145 is where Whittaker takes over, and again there was a huge and rapid drop to around 80, where it now sits.
An AI of 83 (+/-1) is considered to be average. Due to the nature of the index, it being only from those who chose to watch it, as the AI goes below this figure, people don't come back. For the entire pre-Whittaker run (excluding the very start of S1), the series sat at average to well above average. During the last two seasons, the AI has gone way below average. Hence the decrease in viewing figures.