Posts

Appreciation Index

Image
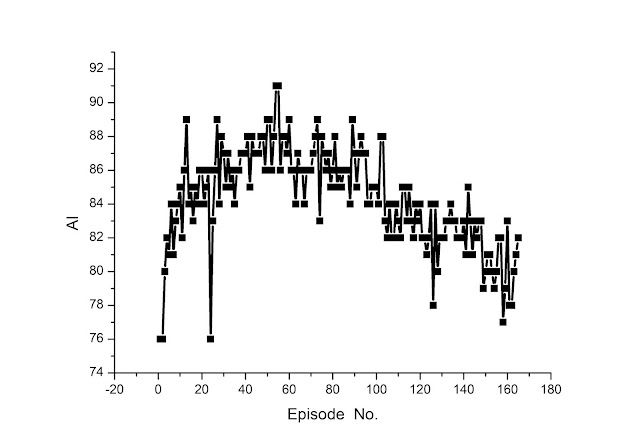
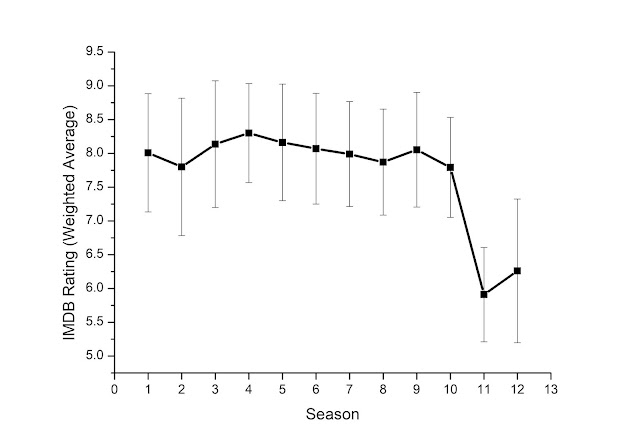
One of the figures easily available is the Appreciation Index . It is a very bad figure, as explained in the wikipedia article. However, trends are visible. Here is the raw data, by episode number of the reboot run (1 = Rose, 165 = The Timeless Children):   Figure 1: Appreciation Index against Episode This data is very noisy, and we can clean it up by looking at the moving five figure average, thus:   Figure 2: The moving five figure average of the data from Fig. 1 This effectively despikes the data, but amplifies the event of singular bad episodes (such as Sleep No More causing a local minima in Capaldi's run). What we can see is that the first few episodes of the reboot had relatively low AI values, which climbed rapidly to be quite good as the audience share dropped a bit. This represents people who don't like Dr. Who, but watched because they were curious. The general trend from the start is a constant increase in AI until the end of David Tenna

IMDB Ratings by Season

Image
The last post broke the ratings down by lead actor. By season the ratings break down thus:   Figure 1: IMDB weighted averages by season A word of explanation of what I've used as a season is necessary. The Christmas specials were placed as appropriate, making such that in no season did the lead actor change (so the first special was placed in S1, but Capaldi's last special in S10). Other shorts and specials were placed as appropriate. The result is: S1: none S2: The Christmas Invasion S3: The Runaway Bride and Time Crash S4: The "five specials" (The Next Doctor through to The End of Time pt 2) S5: none S6: A Christmas Carol S7: The Doctor, The Widow and The Wardrobe, Night of the Doctor, Day of the Doctor and Time of the Doctor S8: none S9: Last Christmas, The Doctor's Meditation and The Return of Doctor Mysterio S10: Twice Upon a Time S11: Resolution S12: none yet (to later have Revolution of the Daleks added) Now, as can be seen, S1 to

IMDB Ratings By Lead Actor

Image
Last year I spent several days pulling together the ratings statistics for the various seasons of Dr Who, but no-one watched the video. Hence I'm simply going to potter around and upload stats and analysis here. One of the major questions is; how do the different lead actors shape up. In order to address this, I have pulled the weighted averages of the various episodes from IMDB, and as of the time of writing the graph looks like this: Figure 1: Average ratings of episodes by lead actor I would contend this indicates that there has been a decline in how well the show is received under the current regime.